Marconi Solutions Coverage Map Project
Marconi Solutions is an Italian mid-sized ISP. It provides fiber and wireless connectivity. Marconi Solutions wanted to serve their customers better while keeping costs in check. The existing tools in the market fell short, leaving Marconi in search of a bespoke solution tailored to their unique needs.
Project Overview
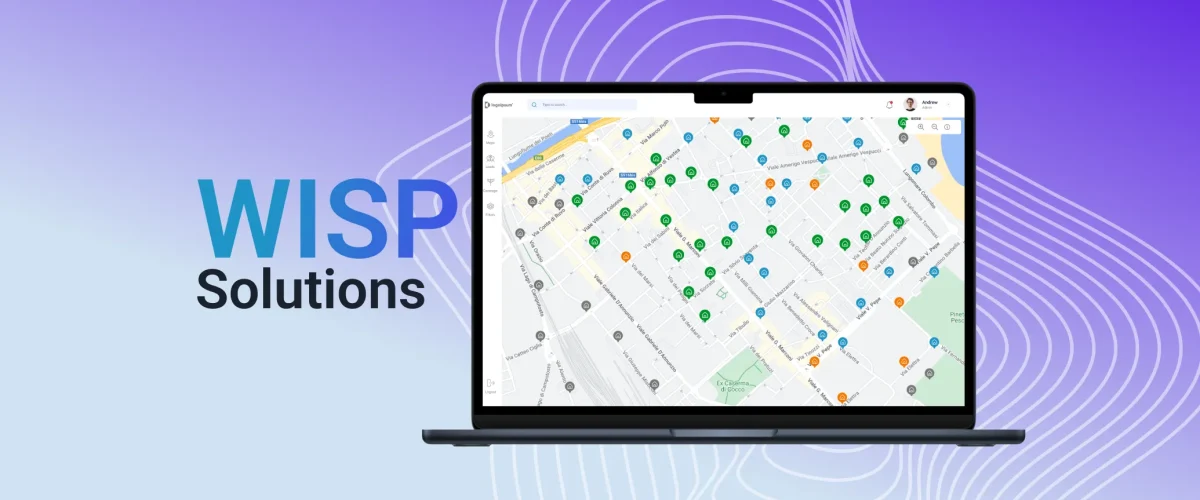
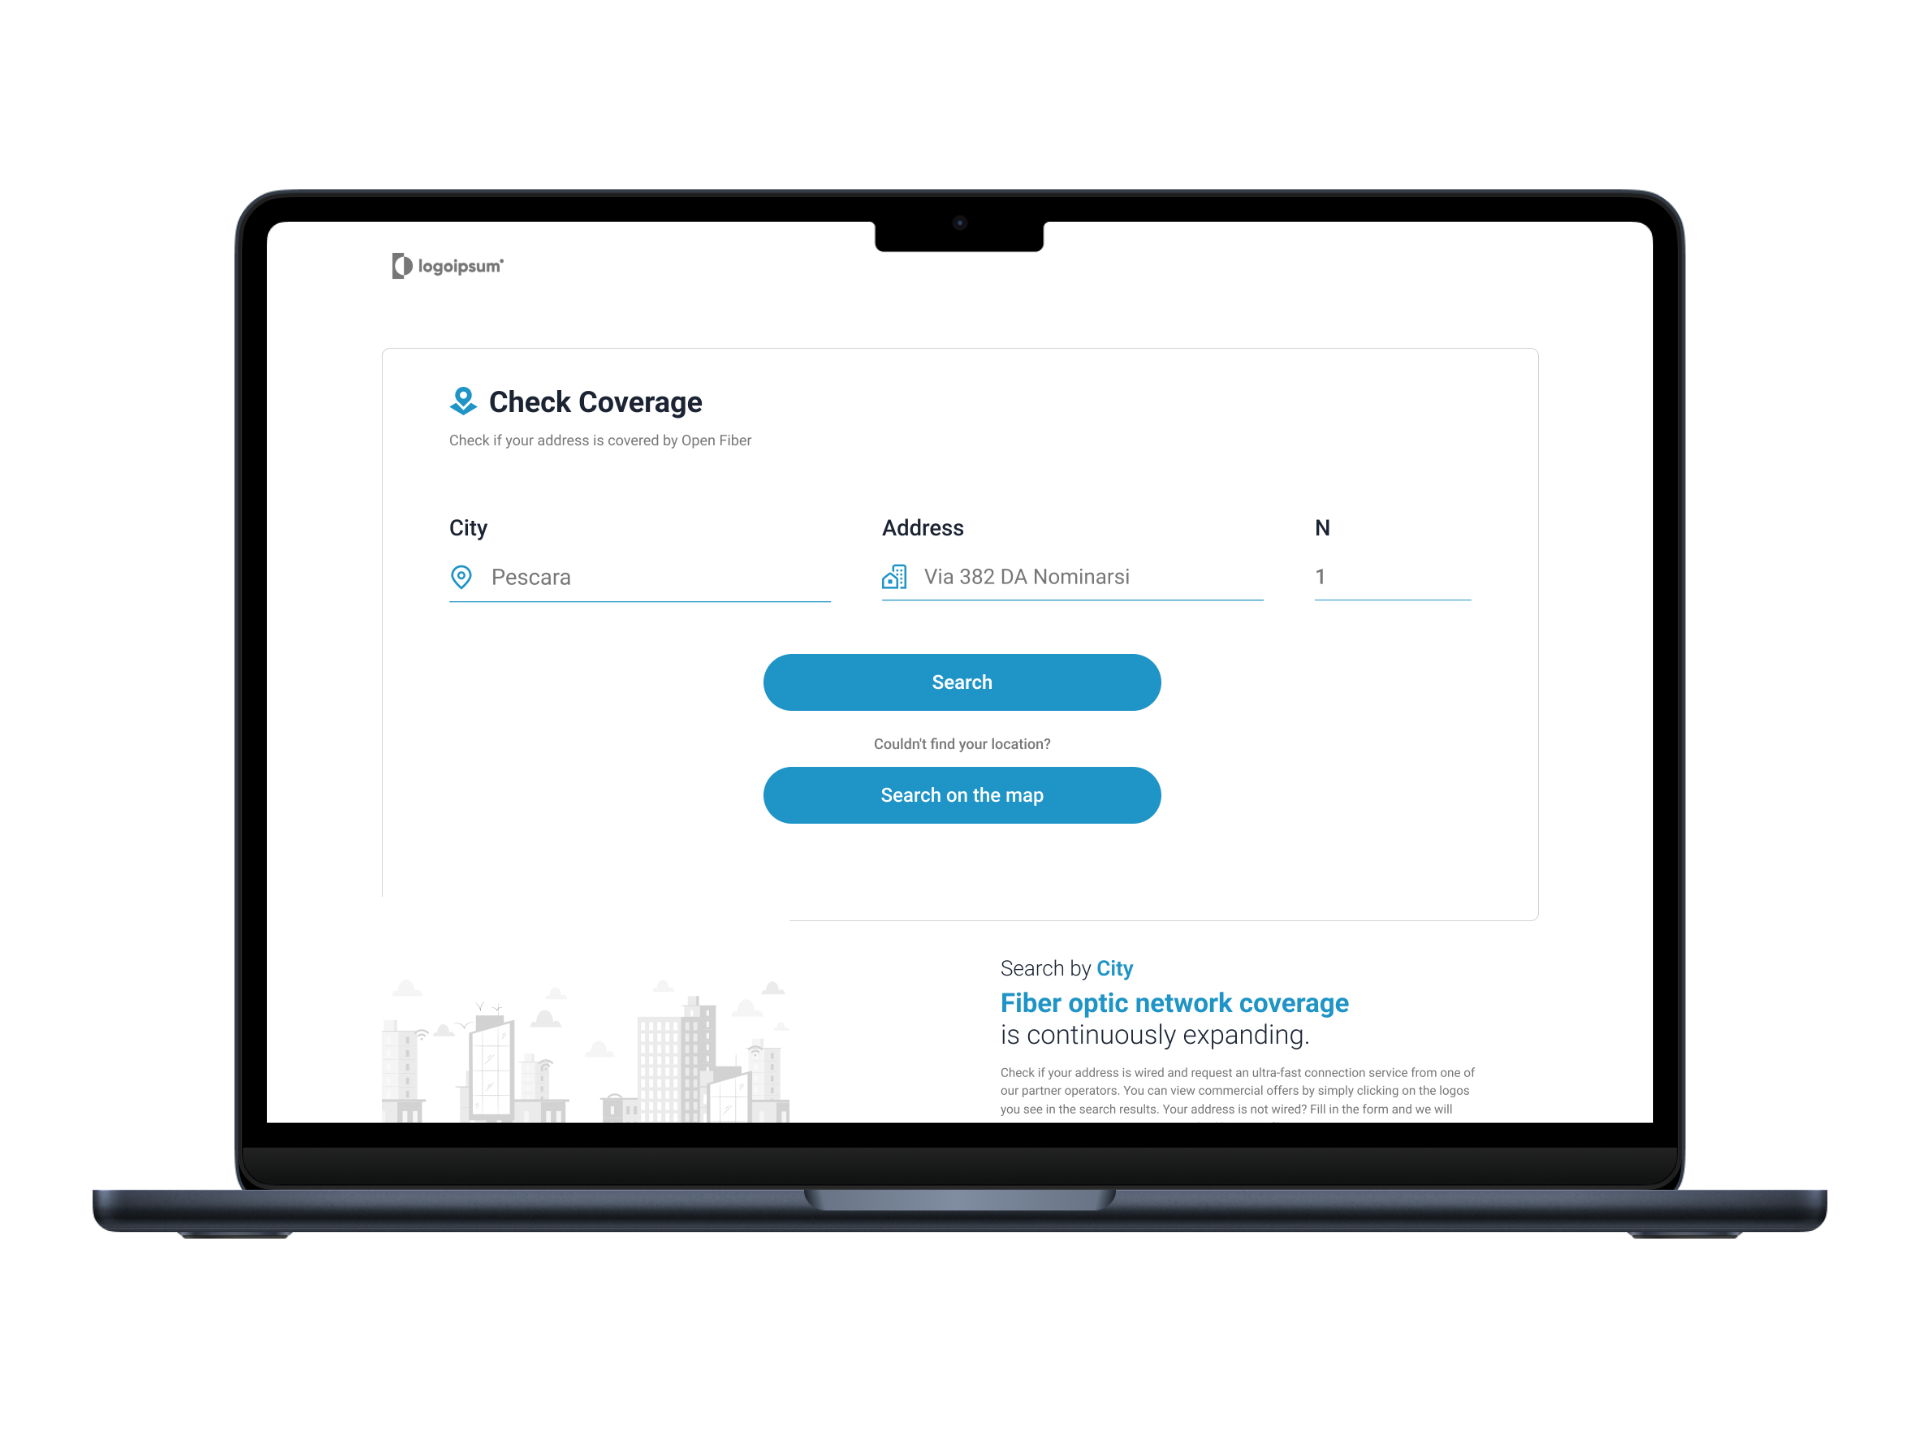
Marconi Solutions wanted to provide their customers with a clear understanding of their coverage areas and make it easy for them to request new connections. With the new coverage map, customers can easily check if their location is covered by Marconi’s services and whether customers are connected via fiber or wireless. Customers can either type their address into the search bar or pinpoint their location on the map. Once customers know their coverage status, they can request a new connection.
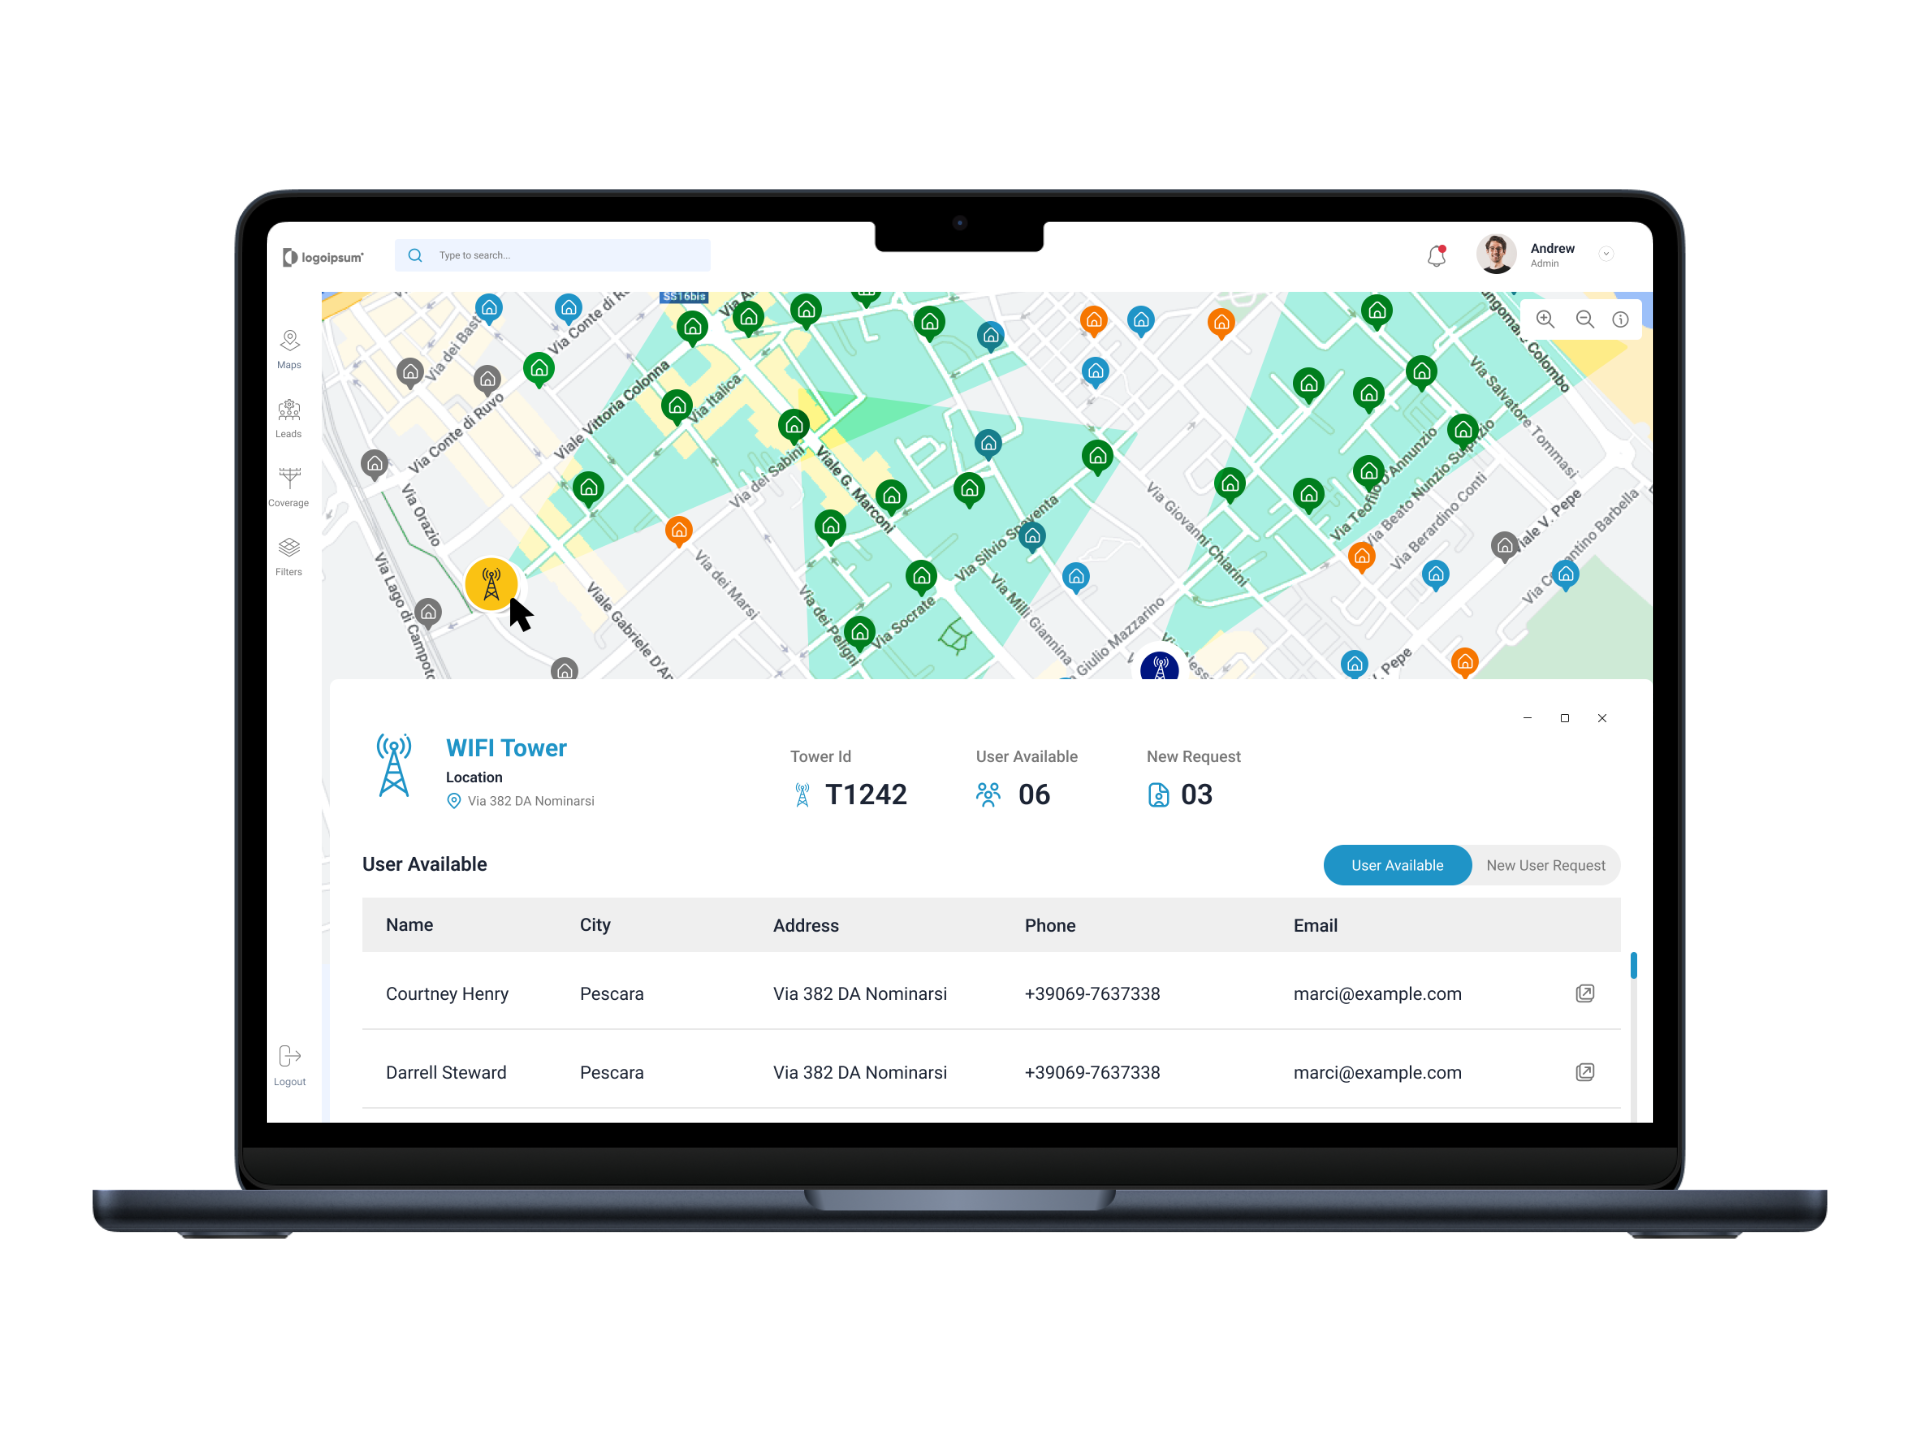
The admins of Marconi can now check news service requests through the web portal. Marconi then can assign someone to check if providing the connection is viable. For Marconi, the new web portal gives them a full view of their operations. They can track the locations of their current customers, see how many new service requests have been made, and understand whether the locations are within coverage or not. Marconi can check the detailed information of their current client. They can also access lead data from a particular date or since the system’s launch. From this data, they can understand in which area there is a growing demand for their service. The portal also provides detailed information about each tower, such as how many devices are connected and which towers should handle specific service requests based on proximity.
The Challenge
Marconi Solutions encountered significant roadblocks with the available coverage map solutions:
- Line-of-Sight (LoS) Problem: One of the most complex hurdles was solving the line-of-sight (LoS) problem.
- Regular Data Update: We had to collect data from 3/4 sources. Thus, the data size would become very big. We have to dump data monthly whenever FTTH providers update data.
- Cost Optimization: Some of the extended APIs that we are calling are paid. So, keeping everything under budget was a major challenge.
Approach
To solve the problem and to build the coverage map we have used the following technological stacks:
- Backend Language and Framework: Python and Django
- Frontend: React
- Integrations: Google Maps, Open Street Maps, FTTH File Servers, Egon
Process Overview
Our plan of action was simple. Research, Ideate, and Execute. Our team studied coverage mapping technologies, leveraging tools like Google Earth and OpenStreetMap, along with multiple other data sources. Understanding the line-of-sight (LoS) was critical to designing a scalable solution. Google Earth provided a strong starting point with its 3D modeling and LoS analysis, but we opted for a more lightweight 2D model to ensure better scalability and cost-effectiveness.
We conceptualized a solution that addressed both customer-facing and administrative pain points. The vision was a clean, intuitive system capable of showing the connection type (fiber vs. wireless) for customer ease. And allowing admins full visibility into customer distribution, tower efficiency, and service request management.
After rigorous research and documentation review, we developed a customized coverage map platform tailored to Marconi’s needs. Our innovative use of mapping data and algorithmic calculations ensured that line-of-sight challenges were solved seamlessly in a lightweight, cost-effective way.
Technical Innovation
Our customized coverage map platform provided multiple technical benefits:
- Line-of-sight (LoS): While most mapping tools, like Google Earth, offer 3D modeling to assess LoS, we opted for a more scalable and cost-effective 2D solution. By leveraging open-source mapping data and advanced algorithmic calculations, we eliminated dependencies on external tools and created a highly efficient system that ensures better scalability without sacrificing accuracy.
- Data Update: We developed a scheduler to automatically fetch data in chunks following updates from FTTH providers, eliminating the need for manual intervention.
- Cost Optimization: To manage costs effectively, we ensured that external paid APIs are not queried redundantly.
Are you ready to transform your operations like Marconi? Contact us today to learn how we can create a tailored solution for your business.
More
See the entire designing process, color palette and typography research info in our Behance.
Still have questions?
Schedule a call with us today.
Our team is here to provide answers and guide you every step of the way.
Still have questions? Schedule a call with us today.
Our team is here to provide answers and guide you every step of the way.

