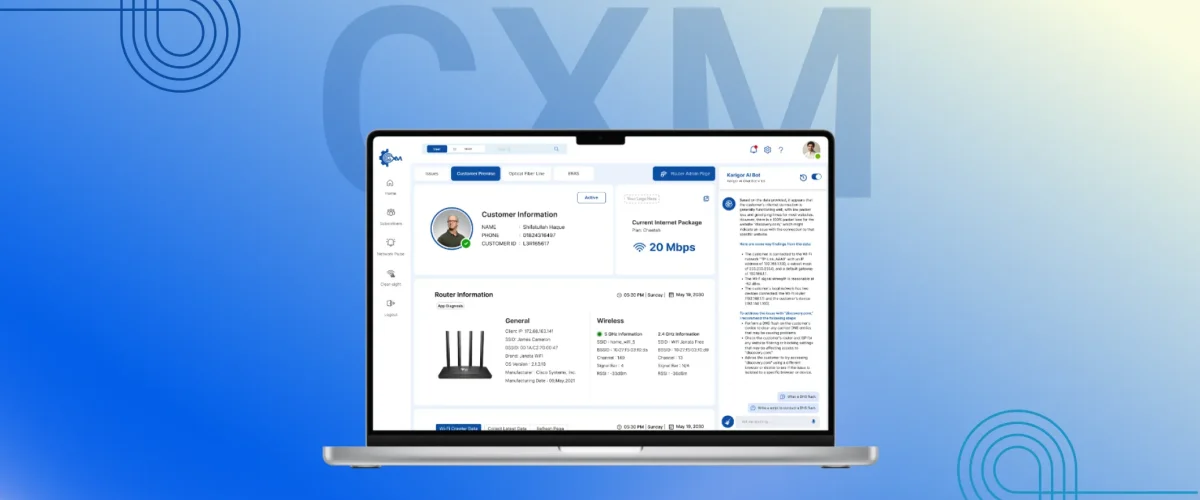
Telecommunication CXM Through Analytics
Imagine transforming an issue-tracking system into a powerful tool that not only tracks customer requests but also measures employee performance, predicts churn, and optimizes network efficiency. This is exactly what we achieved with our ISP Analytics Dashboard, redefining how internet service providers manage operations.
Project Overview
For our client, an ISP managing over 1 million tickets and years of operational data, manual reporting was a major hurdle, taking nearly 100 hours each week to prepare a report, with multiple employees collecting data from various departments. We built an analytics dashboard powered by Microsoft Fabric, seamlessly integrating ISP’s MSSQL-based ticketing system. This solution automated weekly reports, evaluated employee performance, identified churn rates, and streamlined customer management. Additionally, the dashboard provided deep insights into network issues across various distribution levels of the network, enabling proactive problem-solving. It offered clarity on customer management efficiency, highlighted areas for operational improvement, and supported data-driven decision-making, ultimately empowering the ISP to enhance service quality and customer satisfaction.
The Challenges
Building the ISP Analytics Dashboard wasn’t without obstacles. Some of the major obstacles that we faced were:
- Big Data Handling: With over five years of data and 1 million plus tickets, optimizing queries and managing such datasets was critical.
- ERP Migration: Simultaneous data structure changes from an ongoing ERP migration require adaptability.
- Power BI Gateway Configuration: Uploading real-time data to the cloud demanded efficient scheduling via the Power BI Server and Gateway.
- Filtering and Aggregation: Accurate data filtering and aggregation pose technical challenges.
Approach
We relied on an agile methodology and cutting-edge tools to tackle these challenges, including:
- Analytics Platform: We used the Microsoft Fabric ecosystem, particularly Power BI, for visualizations and report generation.
- Data Gateway: Power BI Gateway to streamline data uploads.
- Customer Stack (MSSQL): Integrated data from the customer’s MSSQL Server.
Process Overview
- Database Integration: We began by consolidating five years of operational data from the client’s MSSQL-based ticketing system, comprising over one million rows of ticket records. This step was further complicated by an ongoing ERP migration that altered data structures. We meticulously mapped the old and new schemas, ensuring that historical and current data were aligned. This comprehensive integration provided a unified view of operations while maintaining data integrity across systems.
- Query Optimization: Working with such large datasets requires a strategic approach to query design. Using DirectQuery within a private network, we optimized SQL queries to handle over a million rows efficiently. DirectQuery works by running SQL queries directly on the database where the data is stored, fetching only the necessary results to update the reports. This approach allowed us to implement filtering and aggregation techniques effectively, improving query performance without overloading local resources.
- Report Automation: Previously, preparing reports was a tedious task that took several employees over 100 hours cumulatively each week. Now, we have automated this process where the reports are updated eight times a day automatically.
- KPI Tracking: Built custom metrics to measure employee performance, customer management efficiency, and churn rates.
- Cloud Integration: The client required real-time access to the dashboard across their teams. We configured the Power BI Gateway to bridge their on-premises MSSQL database with Power BI’s cloud environment. This setup allowed seamless data uploads and automatic refresh scheduling, ensuring that users always had access to up-to-date information without manual intervention. To maintain real-time accuracy, we scheduled eight automatic refreshes per day, ensuring that critical insights were consistently up-to-date for the client’s operational needs. As it’s in the cloud, employees can access the dashboards in real-time from anywhere and from multiple devices.
- Dynamic Data Visualization: We created easy-to-use dashboards that provide clear insights into various aspects of the ISP operations. These include breakdowns by zones, performance of different departments, individual employee performance, issue categorization, and connection setup times. These visual tools help the team quickly identify trends and improve network management.
Technical Innovations
- Automated Reporting: We have removed all manual labors in report preparation.
- Employee Performance Metrics: Enabled tracking of task completion rates and efficiency after every 3 hours.
- Customer Churn Analysis: The dashboard revealed key insights into customer churn, highlighting areas with the highest rates and stages where churn occurred most. This enabled the client to target pain points and take proactive steps to reduce churn.
- Seamless Cloud Integration: Configured Power BI Gateway for real-time updates. For this, employees can access the dashboards real time from anywhere and from multiple devices.
- Optimized Query Processing: We used Direct Query to automatically convert Power Query steps into SQL, simplifying data processing.
Our ISP Analytics Dashboard showcases the power of turning raw data into actionable insights, driving efficiency, and improving customer satisfaction.
Ready to transform your business with data-driven solutions?
Contact us today to explore how we can create custom analytics dashboards tailored to your needs.
More
See the entire designing process, color palette and typography research info in our Behance.
Still have questions?
Schedule a call with us today.
Our team is here to provide answers and guide you every step of the way.
Still have questions? Schedule a call with us today.
Our team is here to provide answers and guide you every step of the way.